Cancer |
- Direct Incidence Rates
- SIRs
- Risk Factor Summaries
- FAQs
- Related Links
- Radon Risks and Lung Cancer in Non-Smokers
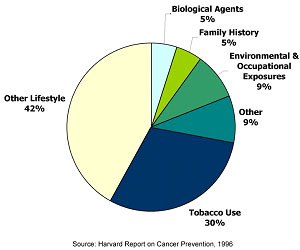
Cancer is not one disease, but a group of diseases. Research has shown that there are more than 100 different types of cancer, each with different causative (or risk) factors. A risk factor is anything that increases a person's chance of developing cancer and may include hereditary conditions, medical conditions or treatments, lifestyle factors, or environmental exposures. Cancer may be caused by several factors acting together over time. The World Health Organization (WHO) estimates that 30% of cancer could be prevented, mainly by not using tobacco, having a healthy diet, being physically active and preventing infections that may cause cancer. In general, most cancers have a long period of development (also known as a latency period) that can range from 10 to 50 years. While not much is known about the latency period for cancers that occur in children, it is assumed to be considerably shorter than in adults.
- Did You Know?
-
Approximately 9% of all cancer deaths are thought to be related to environmental or occupational exposures.
Cancer is common. According to the American Cancer Society, one in two men and one in three women will develop cancer during his or her lifetime. For this reason, cancers often appear to occur in “clusters,” and it is understandable that someone may perceive that there are an unusually high number of cancer diagnoses in their neighborhood or town. Upon close examination, many of these “clusters” are not unusual increases, as first thought, but are related to such factors as local population density, individuals who possess related behaviors or risk factors for cancer, or chance fluctuations in occurrence. Sometimes higher rates that occur over time are due to improved diagnostic techniques and changes in data collection or recording methods. Others, however, are unusual; that is, they represent a true excess of cancer in a workplace, a community, or among a subgroup of people. A suspected cluster is more likely to be genuine if it involves a large number of diagnoses of one type of cancer, a rare type of cancer, or diagnoses occurring among individuals in age groups not usually affected by that cancer type. These types of clusters may warrant further public health investigation.
Cancer incidence data provided on this website are obtained from the Massachusetts Cancer Registry (MCR) within the MDPH Office of Data Management and Outcomes Assessment. The MCR is a population-based cancer registry that collects information on new diagnoses of cancer in Massachusetts.
The MA EPHT website presents cancer data using two different types of statistics: direct incidence rates and standardized incidence ratios. For more information on these statistics, select the Direct Incidence Rates and Standardized Incidence Ratios (SIRs) tabs located at the top of this page.
| Type of rate | Calculation | Geographic Areas | How to use |
|---|---|---|---|
| Type of rate Direct Incidence Rate | Calculation Statewide or county age-specific cancer rate applied to US 2000 Standard Population | Geographic Areas Counties, statewide |
How to use
Can compare cancer rate in one county to that of another across Massachusetts and across multiple states. Comparison is made possible because all rates have been standardized or applied to the same large population (i.e., US 2000 Standard Population). Not appropriate for small areas (census tracts, communities) due to instability of small population numbers. For census tracts and communities, use (SIR). |
| Type of rate Standardized Incidence Ratio (SIR) | Calculation Massachusetts age- and gender-specific cancer rates applied to local (i.e., community or census tract) population | Geographic Areas Census tracts, communities, counties, EP Regions and EOHHS regions |
How to use
Can compare cancer incidence in each community (or census tract) to Massachusetts as a whole. However, cannot compare the SIR of one community (or census tract) to that of another. Communities are not directly comparable to each other unless they have the exact same age/gender compositions. |
- Data Considerations
-
When reviewing and interpreting cancer incidence data, it is important to consider the following:
- Data will only be presented to the public if the confidentiality rules of MDPH and the Massachusetts Cancer Registry (MCR) are met. These are rules requiring data aggregation and suppression to protect privacy.
- Statistical significance for SIRs is assessed to determine if the observed number of diagnoses is statistically significantly different from the expected number of cancer diagnoses (based on the statewide experience), or if the difference may be due solely to chance. Statistical significance is determined by the 95% confidence interval.
- MA EPHT incorporates the use of the Relative Standard Error (RSE) when assessing statistical stability. The RSE which provides a measure of reliability for direct incidence rates and SIRs. When the RSE is greater than 30%, the rate is unstable and caution should be exercised when interpreting results.
- Numbers and rates may differ slightly from those contained in other publications. These differences may be due to file updates, differences in calculation methods (such as grouping ages differently or rounding off numbers at different points in calculations), and updates or differences in population estimates.
- Information about Cancer Data on this Website
-
Cancer data are presented on the MA EPHT website using two different types of statistics:
- Direct Incidence Rates
A direct incidence rate is the most appropriate statistic to compare cancer incidence in one relatively large area to another relatively large area (such as one county to another).
- Standardized Incidence Ratios (SIRs)
An SIR is the most appropriate statistic to examine cancer incidence in a small area, such as a community or a census tract within a community, and compare it to cancer incidence in a large, stable population (such as a state).
- Direct Incidence Rates
-
Direct Incidence Rates versus Standardized Incidence Ratios (SIRs)
It is important to emphasize the difference between the two types of cancer incidence rates that are presented on the MA EPHT portal. The direct age-adjusted cancer incidence rate is most appropriately used for larger, more stable study populations, such as a state or county. Because of the way it is calculated, it may be used to compare the cancer incidence rate of one geographic area to another (such as one county to another).
The other statistic, the standardized incidence ratio (SIR), is most appropriately used when the population is small, such as that of a community or a census tract. It is used to evaluate whether the occurrence of cancer within a community or a census tract differs from that of the state as a whole. The SIRs for individual communities or census tracts cannot be directly compared to one another. This is because the age distribution of a community has a strong effect on the number of expected diagnoses, and no two communities have the same age distributions within their populations. Comparisons of the SIRs for two communities would be valid only if there were no differences in the age and sex distributions of the two communities’ populations.