Standardized Incidence Ratios for Cancer |
- Cancer Overview
- Direct Incidence Rates
- Risk Factor Summaries
- FAQs
- Related Links
- Radon Risks and Lung Cancer in Non-Smokers
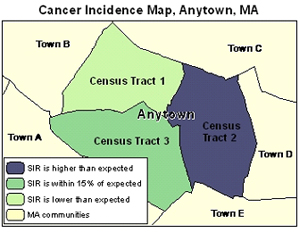
A standardized incidence ratio (SIR) is the most appropriate statistic to examine cancer incidence in a small area, such as a community or a census tract. For example, an SIR might be used to determine whether prostate cancer occurred more frequently than expected in Boston, compared to Massachusetts as a whole.
An SIR is the ratio of observed cancer diagnoses in an area to the number of expected diagnoses multiplied by 100. The expected number is based on the statewide cancer experience.
Comparison of SIRs between communities or census tracts is an inappropriate use of the statistic. Such comparisons are inappropriate because the age distribution or structure of a community has a strong effect on its cancer rates, and no two communities have the same age distributions within their populations. Comparisons of the SIRs for two communities would be valid only if there were no differences in the age and sex distributions of the two communities’ populations. An SIR can appropriately be used to evaluate whether the cancer incidence of a community or census tract differs from that of the state as a whole.
One calculation will generate:
- An observed number of diagnoses
- An expected number of diagnoses
- A SIR
- A 95% Confidence Interval
Example: Interpreting an SIR
Let us say that Community A has an SIR of 200 for prostate cancer during 2000-2004, while Community B has an SIR of 100 for that same cancer during that same period. In this case, it would be accurate to say that in Community A, prostate cancer is roughly twice as common as expected compared to Massachusetts as a whole, while in Community B, it is about as expected compared to Massachusetts as a whole. The “expected” number of cancers refers to the number of diagnoses that would be expected in that community based on the age adjusted cancer rate in Massachusetts as a whole. However, it would not be accurate to say that in Community A, prostate cancer is twice as common as in Community B. Again, this is because Community A and Community B do not have comparable age distributions, and prostate cancer is strongly affected by age.
| Cancer Type | Community | Observed | Expected | SIR | 95% CI |
|---|---|---|---|---|---|
| Cancer Type Prostate | Community Community A | Observed 6 | Expected 3.0 | SIR 200 | 95% CI 73–435 |
| Cancer Type Prostate | Community Community B | Observed 11 | Expected 11 | SIR 100 | 95% CI 50–179 |
| Data Source: Massachusetts Cancer Registry | |||||
For more information on standardized incidence ratios for cancer, see the FAQ.
- Data Considerations
-
When reviewing and interpreting Cancer data, it is important to take into consideration the following:
- Comparison of SIRs between communities or census tracts is not possible because each of these areas has different population characteristics.
- Counts and rates are calculated based upon residential address at the time of diagnosis. No information is available on prior residences.
- To protect privacy, no information is shown that could identify an individual. Data suppression rules govern the release of small case counts.
- Statistical significance for SIRs is assessed to determine if the observed number of diagnoses is statistically significantly different from the expected number of cancer diagnoses (based on the statewide experience), or if the difference may be due solely to chance. Statistical significance is determined by the 95% confidence interval.
- MA EPHT incorporates the use of the Relative Standard Error (RSE) when assessing statistical stability. The RSE provides a measure of reliability. When the RSE is greater than 30%, the rate is unstable and caution should be exercised when interpreting results.
- Numbers and rates may differ slightly from those contained in other publications. These differences may be due to file updates, differences in calculation methods (such as grouping ages differently or rounding off numbers at different points in calculations), and updates or differences in population estimates.
- Available Data on SIRs for Cancer
-
Use the Explore Maps & Tables link link to access the following measure for cancer in your community. The most current available data will be shown. Be sure to check the site periodically for new data as it becomes available.
- SIRs are available by sex for 23 types of cancer for individuals of all ages and 5 types of childhood cancer
- SIRs are available for census tracts, communities, counties, Emergency Preparedness (EP) Regions, and Executive Office of Health and Human Services (EOHHS) regions