Carbon Monoxide Poisoning |
- -1 = Data not shown when case counts < 11. These small numbers are suppressed to protect privacy.
- Unstable rates must be interpreted with caution. To see more detailed data with stability information, please use the Explore Maps & Tables link on this page.
- Age-adjusted rates are displayed for all causes (i.e., fire-related, non-fire related, and unknown).
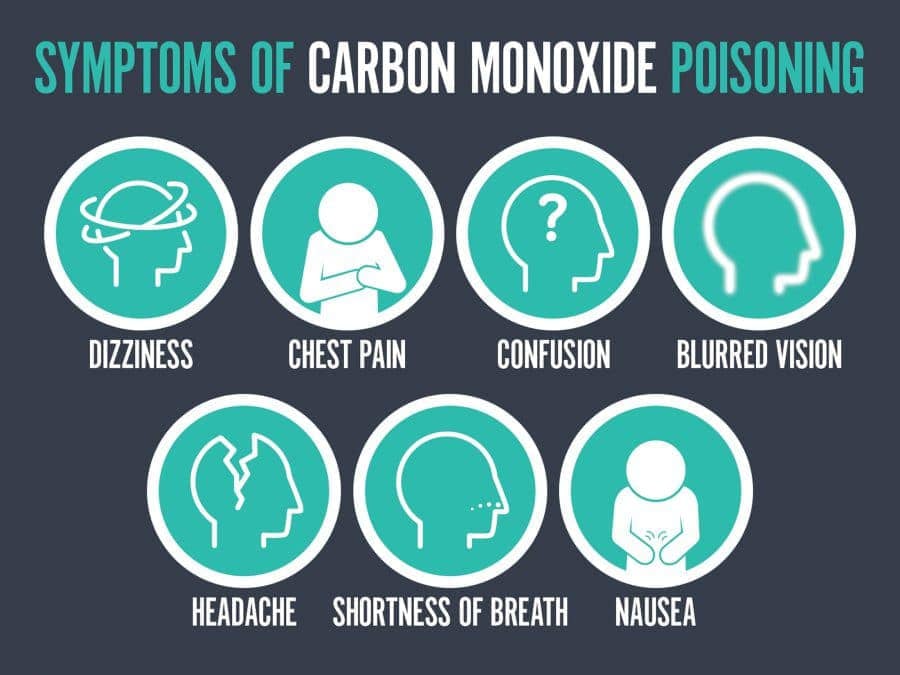
Carbon monoxide (CO) is a common, potentially lethal gas produced by the incomplete combustion of fossil fuels such as gasoline or wood. CO poisoning results from breathing air that contains CO gas. CO poisoning results in a range of symptoms from mild to severe, including death.
You may be exposed to unsafe levels of CO from:
 Source: FEMA
- House or building fires
- Poorly maintained or unvented heating equipment
- Running motor vehicles indoors (e.g., in garages or other enclosed spaces)
- Using a gas stove, oven, or grill to heat the home
- Cooking with a charcoal or gas grill inside the home or other enclosure
- Clogged chimneys or blocked heating exhaust vents
- Operating generators or gas-powered tools indoors or outside near windows, doors or intake vents
- Using a propane camp stove, heater, or light inside a tent
- Engaging in activities near motor vehicle engine exhaust outlets, including boats
- Did You Know?
- On March 31, 2006, "Nicole’s Law" went into effect requiring CO detectors in all Massachusetts homes with potential sources of CO – those with fossil-fuel burning equipment or enclosed parking areas. "Nicole’s Law" was named for 7-year old Nicole Garofalo who died on January 28, 2005 when the furnace vents of her Plymouth home were blocked by snow drifts causing deadly amounts of CO to build up in the house. The regulations (527 CMR 31.00) establish requirements for the type, location, maintenance, and inspection of CO alarms.
The release of CO is almost entirely preventable by the correct installation, maintenance, and operation of devices that may emit carbon monoxide. Combined with the appropriate use of carbon monoxide detectors (also called carbon monoxide alarms), CO poisoning is highly preventable.
The EPHT program has identified the need for surveillance of unintentional CO poisoning to support public health prevention and intervention activities. Tracking the occurrence of CO poisoning can also provide information on CO exposures following disasters and storms when emergency generator use increases.
Data on hospitalization visits are collected by the Massachusetts Center for Health Information and Analysis (CHIA) from all acute care hospitals and satellite emergency facilities in the state. CHIA collects information on all inpatient hospital admissions and emergency department (ED) visits.
- Data Considerations
-
When reviewing and interpreting CO poisoning data, it is important to take into consideration the following:
- There is no information about specific sources of CO poisoning, but hospitalizations and deaths are identified as being fire-related, non-fire related, or unknown.
- Hospitalization data, by definition, exclude discharges from specialty hospitals (e.g., psychiatric), long-term care facilities, and federal hospitals that are exempt from state reporting requirements.
- Hospitalization data do not include individuals who do not receive medical care or who are not hospitalized, including those who die in emergency rooms, in nursing homes, or at home without being admitted to a hospital, and those treated in outpatient settings.
- Transfers from one hospital to another may be included in the dataset as separate hospitalization events.
- Emergency department data include all CO poisoning hospitalizations that originated in an ED, including those later admitted as inpatients. For this reason, there is overlap between the two datasets and many patients are included in both the inpatient and ED hospitalization data reported on this site. CO poisoning counts and rates should, therefore, not be summed across the two measures of hospitalization.
- Hospitalization data are validated through a process of automated editing and report verification. In addition, each record is subjected to a series of edits that check for duplicate records, accuracy, consistency, completeness, and conformity.
- Numbers and rates may differ slightly from those reported on the national EPHT portal. These differences may be due to file updates, differences in calculation methods (such as grouping ages differently or rounding off numbers at different points in calculations), and updates or differences in population estimates.
- Hospitalization data will only be presented to the public if the confidentiality rules of MDPH and CHIA are met. These are rules requiring data aggregation and cell suppression to protect privacy.
- Differences in rates between jurisdictions may reflect differences in hospital admissions practices for treating persons with severe CO poisoning. For example, some facilities may routinely admit all patients treated with hyperbaric oxygen, while others may release such patients after they complete the treatment if they are determined to be in stable condition.
- Rates are based on the residential address of patients and not necessarily the location where exposure occurred.
- Available Data on Carbon Monoxide Poisoning
-
Use the Explore Maps & Tables link on this page to access the following measures for Carbon Monoxide Poisoning in your community on the right toolbar. The most current available data will be shown. Be sure to check the site periodically as new data are added each year.
To protect privacy, no information is shown that could identify an individual.
Hospitalization
- Annual number of hospitalizations / ED visits / deaths
- Annual crude rate per 100,000 population
- Annual age-adjusted rate per 100,000 population
- Explore data in tables, charts, and maps
- All of the measures above are available by community, county, and statewide