Tutorials - Running a Query |
- How to Use Tracking
- Home Page
- Finding a dataset
- Mapping: key features
- Mapping: advanced settings
- Mapping: finding your address
- Tables
Overview:
- On the query page, add in important information about the population or geographic area you want to explore.
- Note that you should avoid using Internet Explorer.
- Select options provided in order, from top to bottom and left to right, then select “Submit”.
- It may take a few minutes for the page to load depending on how much data is available and your browser type.
- The selected data will automatically appear when the run is complete.
- Below are some examples of queries you can run:
- Health Outcome, Cancer
- Environmental Exposure, Air Quality
- Inspection, Food Processing
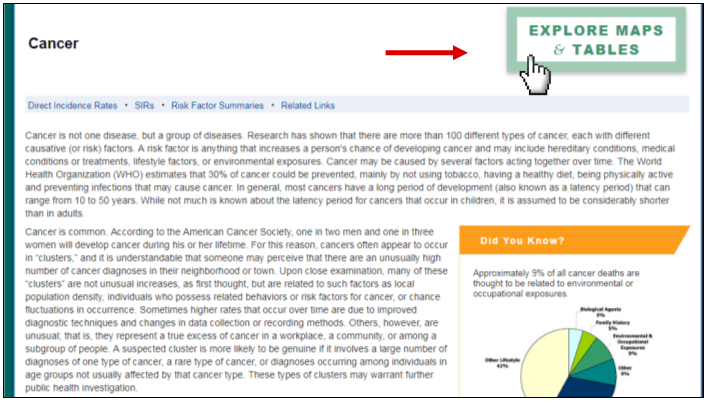
1a. Health Outcome (Cancer):
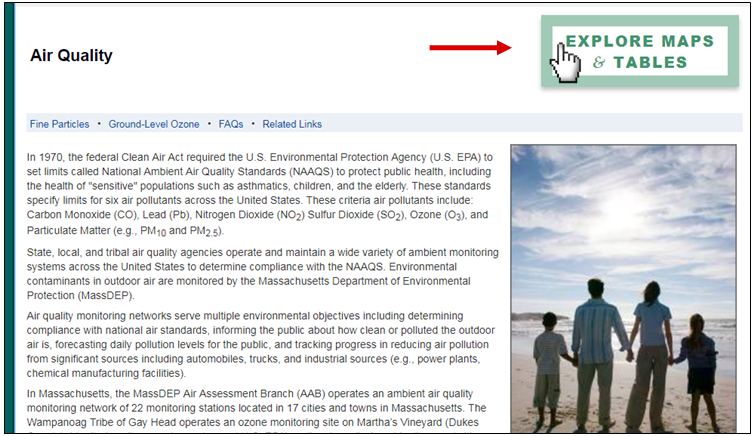
Click on the green Explore Maps & Tables icon on the top right of the cancer topic page. On a mobile device the icon will be at top center of the page.
1b. Health Outcome (Cancer):
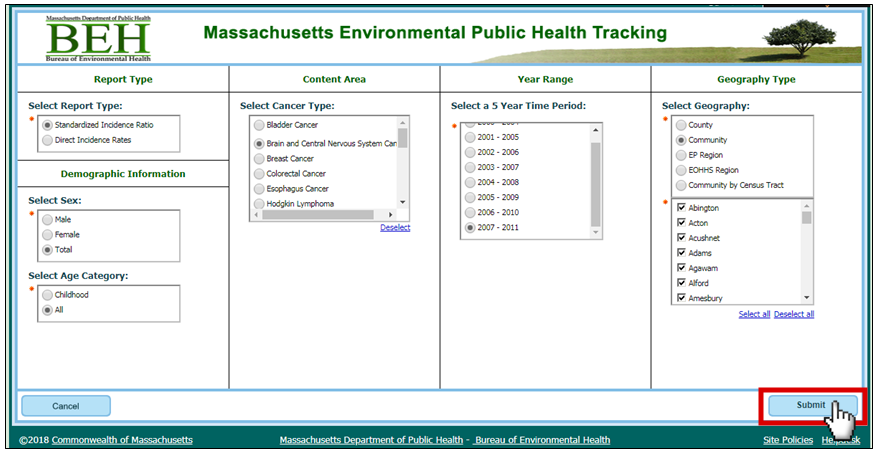
Select a report type, sex, age category, cancer type, 5-year time period, and geography.
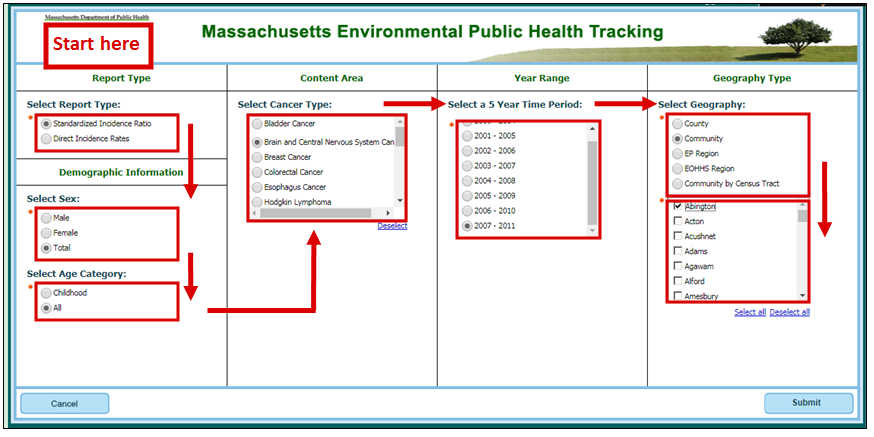
1c. Health Outcome (Cancer):
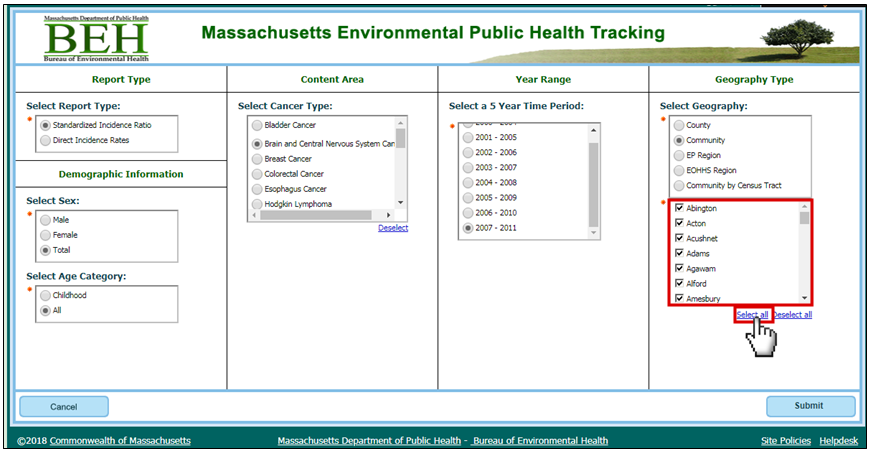
Select more specific geography by checking the boxes. Check all the boxes by clicking on Select all. Uncheck all the boxes by clicking on Deselect all.
1d. Health Outcome (Cancer):
Select Submit on the bottom right to run the query.
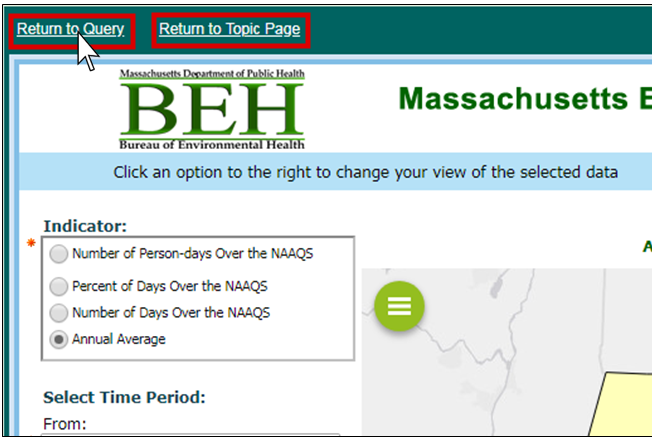
1e. Health Outcome (Cancer):
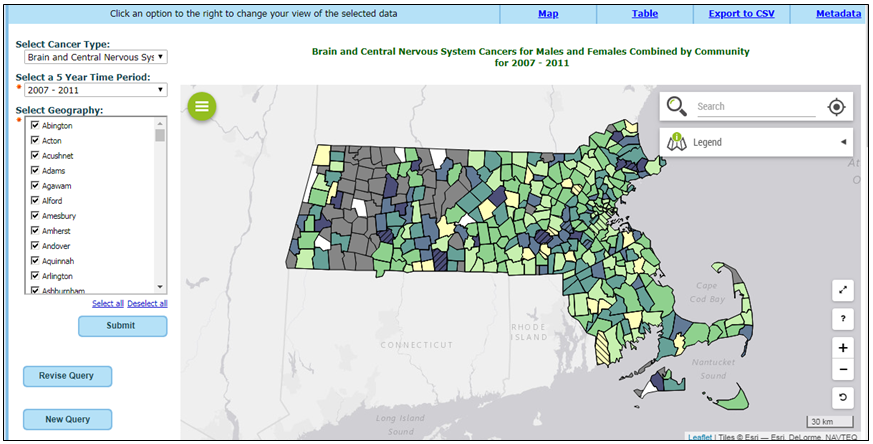
A map will automatically appear with the selected data.
1f. Health Outcome (Cancer):
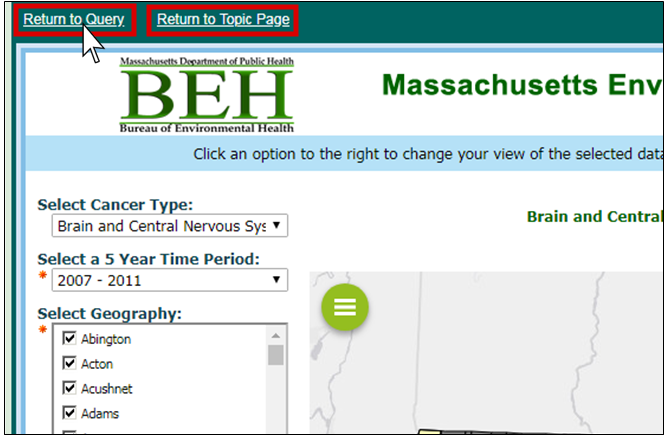
Want to go to back? On the top left, click Return to Query to edit your entry or click Return to Topic Page to return to the topic.
2a. Environmental Exposure (Air):
Click on the green Explore Maps & Tables icon on the top right of the air quality topic page. On a mobile device the icon will be at top center of the page.
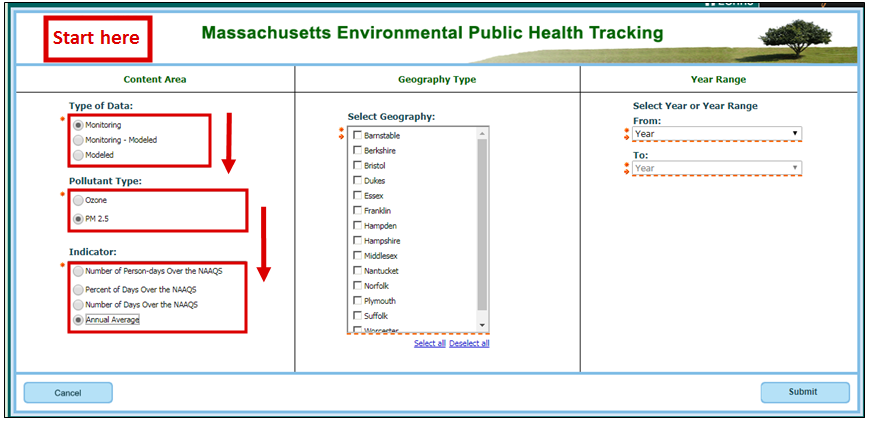
2b. Environmental Exposure (Air):
Select data type, pollutant type, and indicator.
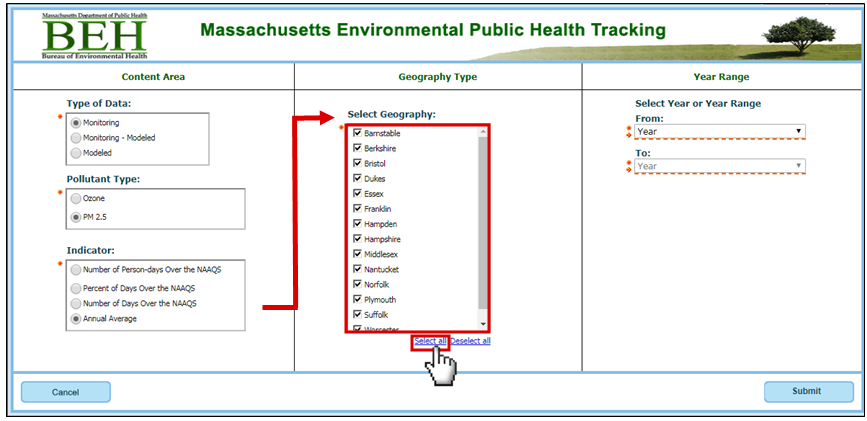
2c. Environmental Exposure (Air):
Select your geography by checking the boxes. Check all the boxes by clicking on Select all. Uncheck all the boxes by clicking on Deselect all.
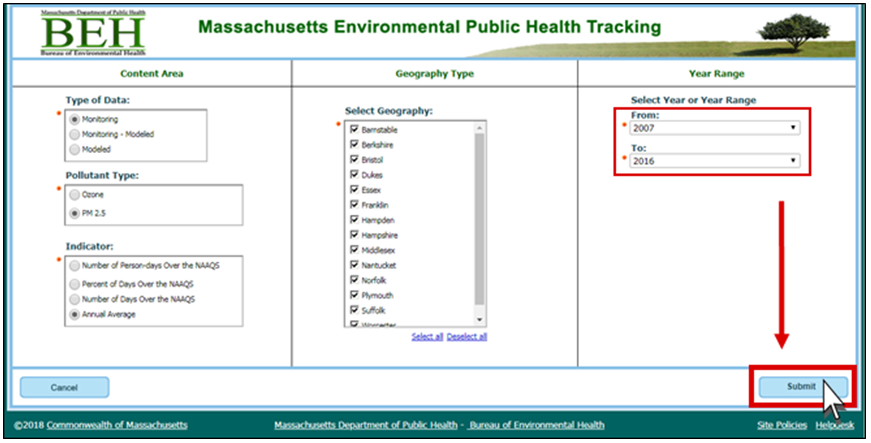
2d. Environmental Exposure (Air):
Select one year or a year range using the drop-down list(s). Then click on Submit.
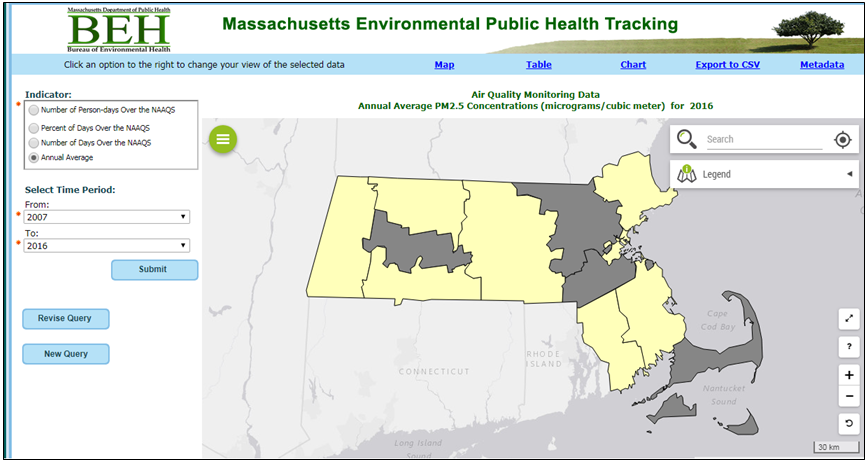
2e. Environmental Exposure (Air):
A map will automatically appear with the selected data.
2f. Environmental Exposure (Air):
Want to go to back? On the top left, click Return to Query to edit your entry or click Return to Topic Page to return to the topic.
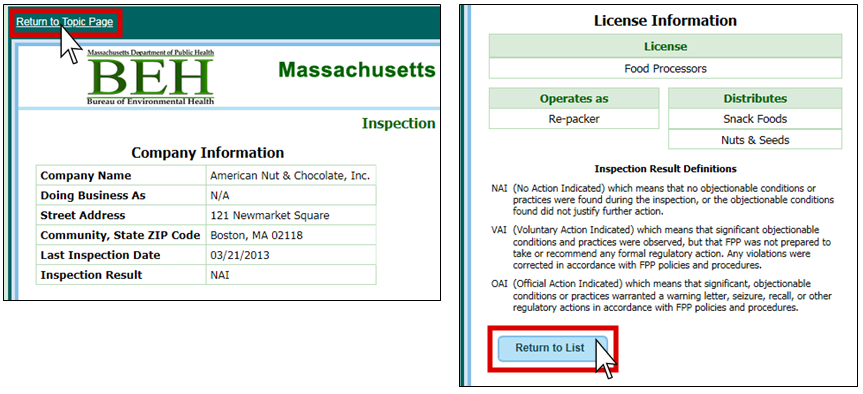
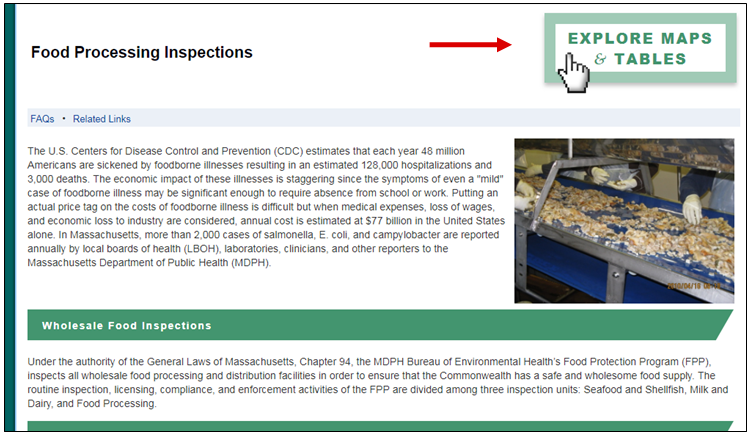
3a. Inspection (Food Processing):
Click on the green Explore Maps & Tables icon on the top right of the topic page. On a mobile device the icon will be at top center of the page.
3b. Inspection (Food Processing):
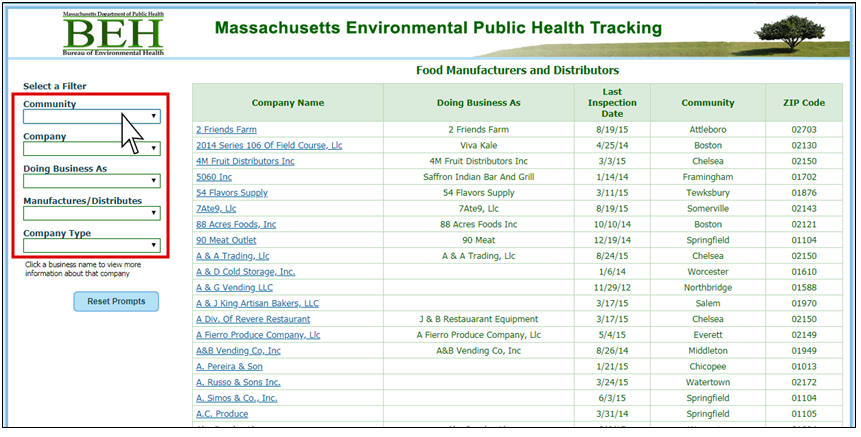
Select a filter to narrow your selection, more than one may be necessary.
3c. Inspection (Food Processing):
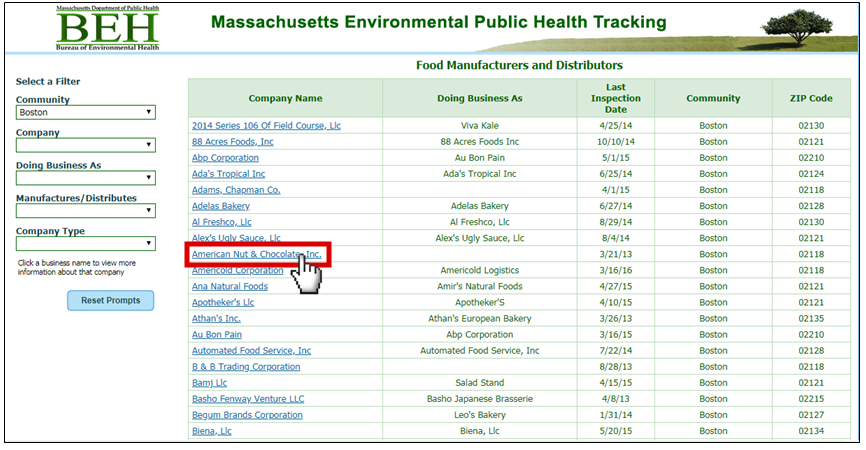
Select a desired company name link.
3d. Inspection (Food Processing):
The inspection result (NAI, VAI, or QAI) is listed in the first table and the result definitions are listed at the bottom on the page.
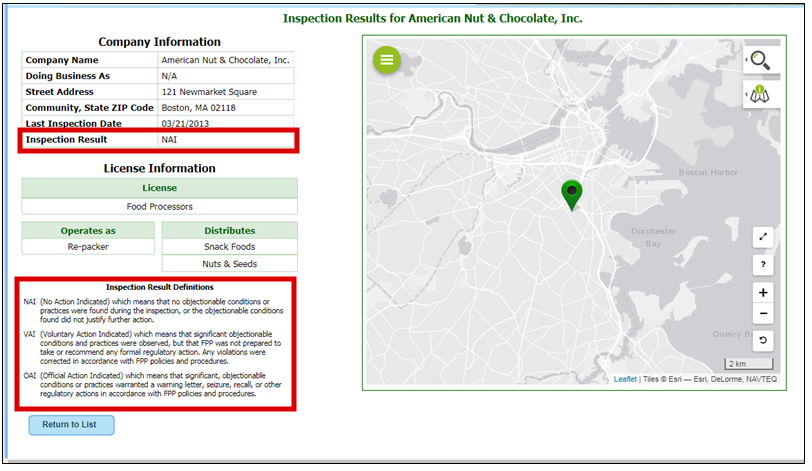
3e. Inspection (Food Processing):
Want to go to back? On the top left, click Return to Topic Page to return to the topic or on the bottom of page click “Return to List” to select another company.