=
Tutorials -Data Tables |
- How to Use Tracking
- Home Page
- Finding a dataset
- Running a query
- Mapping: key features
- Mapping: advanced settings
- Mapping: finding your address
Overview:
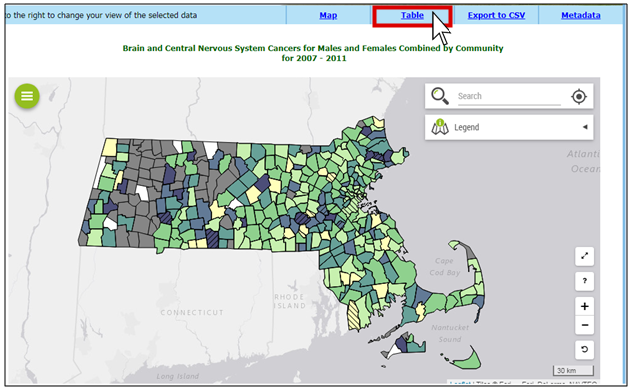
1. Table:
Look at your query in a tabular form by selecting the “Table” option on the top right of the page.
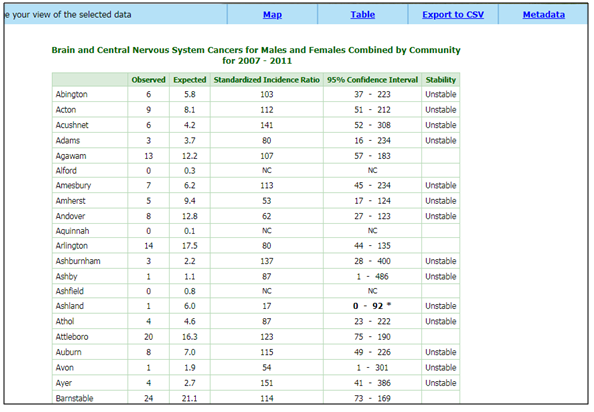
2. Table:
A table will appear with the selected information.
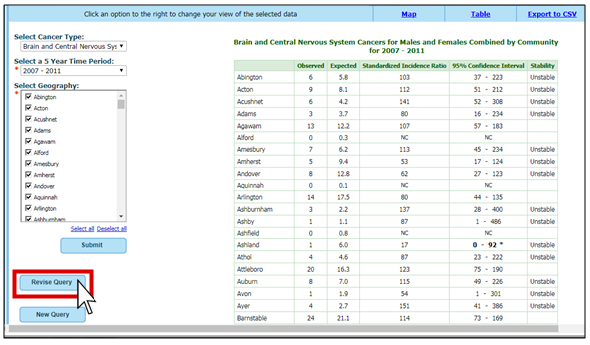
3. Table:
Want to go to back? On the bottom left, click “Revise Query” to edit your entry or click “New Query” to create a new one.
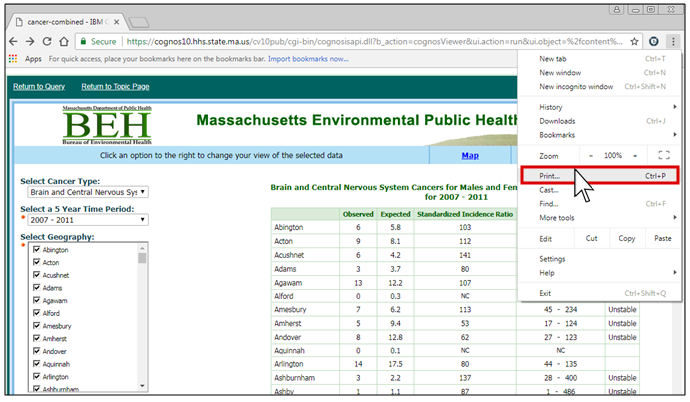
4. Printing a Table:
Click File and Print on your browser. Your browser options may be in a different location.
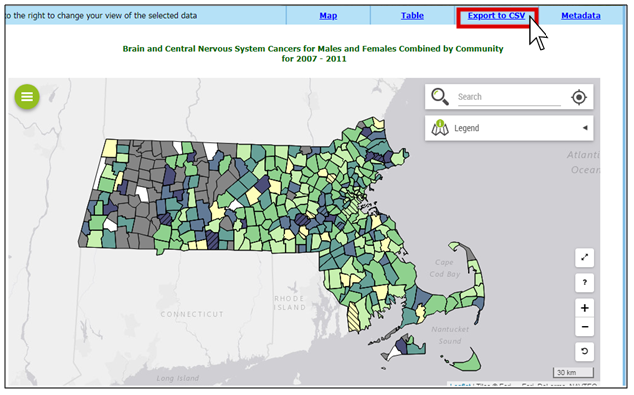
5. Export Data:
Select the Export to CSV option on the top right of the page to obtain a file with your query selection. The file should appear in your Downloads folder saved as a csv. If the data doesn’t automatically open in Excel, save it as an .xls file.
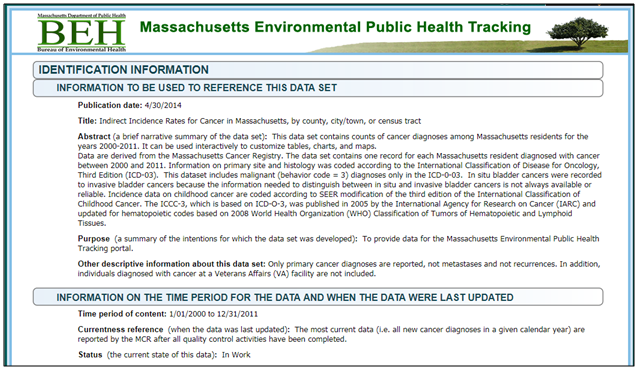
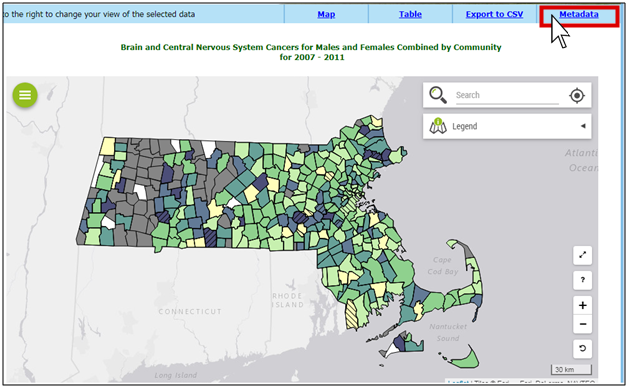
6. Metadata:
Select the “Metadata” option on the top right of the page. Metadata is the data about your data.
7. Metadata:
This is what the metadata page will look like. Sections include Identification Information, Data Quality Information, Entity and Attribute Information, Distribution Information, and Metadata Reference Information.