A Newsletter of the Massachusetts Department of Public Health Bureau of Climate and Environmental Health
Environmental Public Health Tracking Program
2021 Volume 4, Issue 1
News and Updates
 Content update:
- New Lead in Soil fact sheet
- New Choose Safe Places resource to help early education and childcare programs with screening proposed locations for environmental hazards
- New Environmental Justice Tool
- New Radon and Lung Cancer data story
- New widget on the Climate Change page showing projected temperature and precipitation data
 Data update:
- Direct Cancer Rates to 2016 and Standard Incidence Ratios to 2015
- Hospitalization Data (Asthma, Carbon Monoxide Poisoning, COPD, Heart Attack, and Heat Stress) to 2017
- Childhood Blood Lead data to 2019
Featured Topic: Emergency Preparedness Populations Planning Tool
The Emergency Preparedness Populations Planning Tool (EPPPT) is a data report designed to facilitate planning and improve readiness of all community members during emergencies. It enables local and regional emergency planning that is inclusive of at-risk residents. Modeled after our Community Profiles, the EPPPT provides demographics data and built environment infrastructure information by census tract, county, and HMCC region (Health and Medical Coordinating Coalition). The tool is intended for a wide audience, ranging from emergency planners and local public health officials to community leaders and residents. It has wide-ranging applications, from complex all-hazards disaster plans to simple information gathering about an area. The report can be viewed online or saved as a printable PDF.
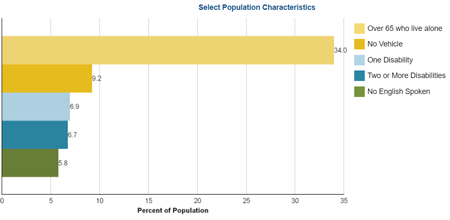
Many factors can impact a person’s ability to prepare for or respond to emergencies - be it their age, a cognitive or sensory impairment, or lack of access to a vehicle. These and other population characteristics are displayed graphically with the click of a button.
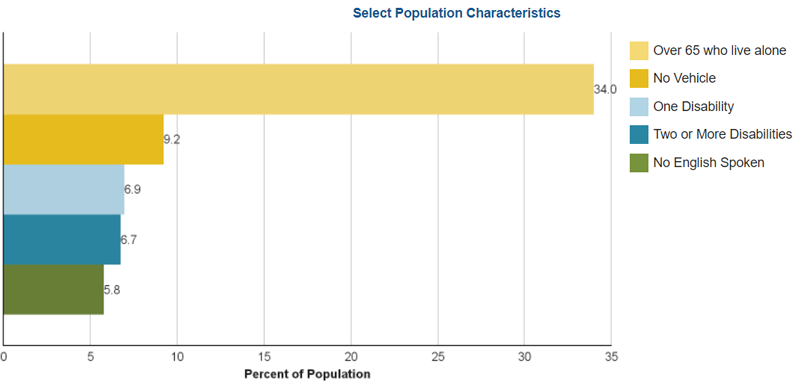
The chart to the right shows EPPPT data for at-risk populations in Lynn. Emergency planners or community leaders can use this information to prioritize support for at-risk residents during emergencies - items like collapsible wheelchairs, transport services, and translated materials.
The Power of Mapping
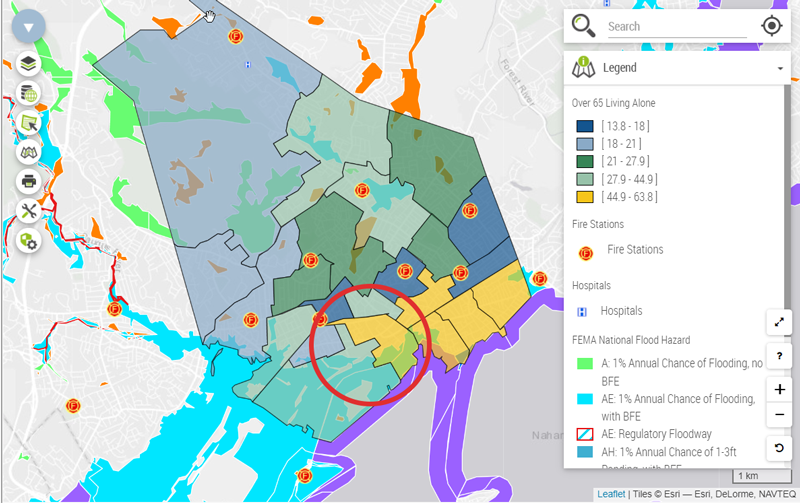
For planning, outreach, or engagement efforts in your community, take advantage of the EPPPT’s interactive mapping feature. When population information is mapped, location-specific investigations and planning are made possible. Users can view multiple hazard layers in combination with population risk factors and infrastructure resources (e.g. hospitals, fire and police stations).
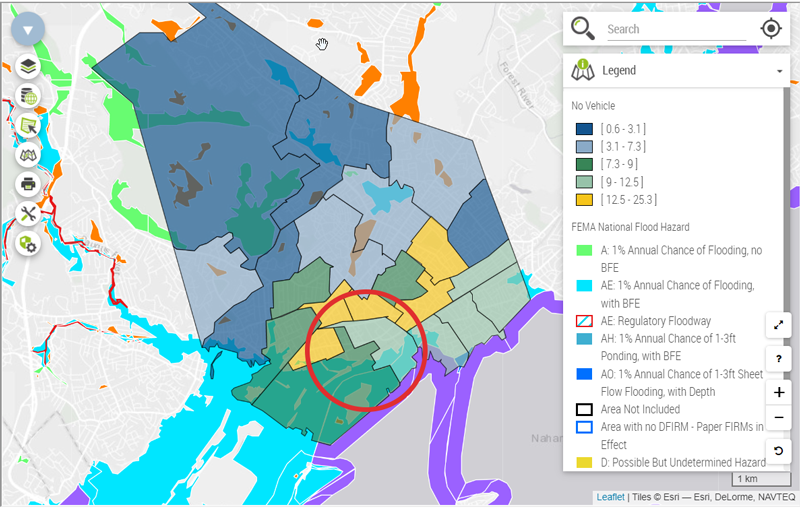
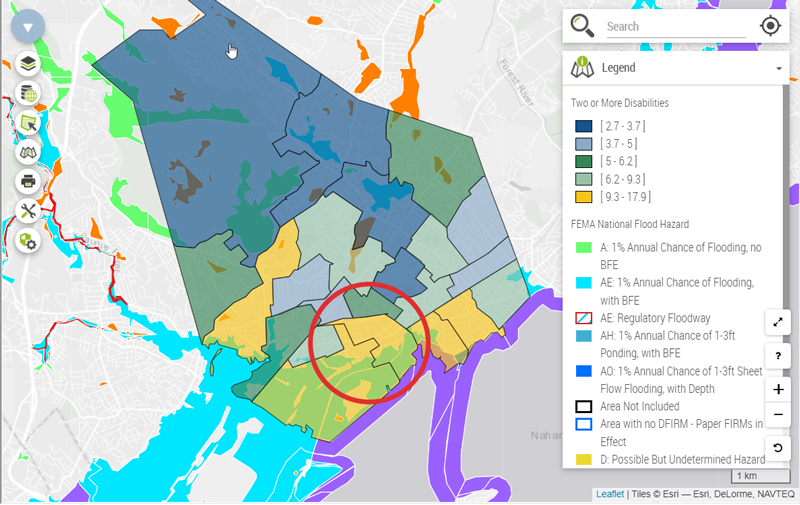
The maps to the right show Lynn by census tract for three of the at-risk populations described in the chart above - those over 65 and living alone; those with no vehicle; and those with two or more disabilities. In each map, the census tracts in yellow reflect areas where the greatest proportion of the specified at-risk residents live. The FEMA national flood hazard layer shows the overlap of at-risk populations and areas of high flooding risk. Additional layers - the public safety and healthcare facility layers - are included in the first map to show the location of hospitals and fire stations.
By using data in the interactive mapping component of the EPPPT, we can identify census tracts such as this one (circled in red) that have multiple at-risk populations, allowing resources and services to be targeted to these at-risk groups.
The EPPPT is an important tool for comprehensive emergency planning. Combining demographic data with location-specific maps assures that preparedness strategies can be tailored to the hazards and at-risk populations of the area of interest.


