Massachusetts Department of Public Health seal Massachusetts Environmental Public Health Tracking

Tutorials - Emergency Prepardness Populations Planning Tool

Emergency Preparedness Portal

Overview:

  • Find emergency preparedness information for your community
    • Note that you should avoid using Internet Explorer
  • Use the mapping tools to visualize your selected location
  • Add layers or base map settings to enhance your map
  • Locate an address using the search bar
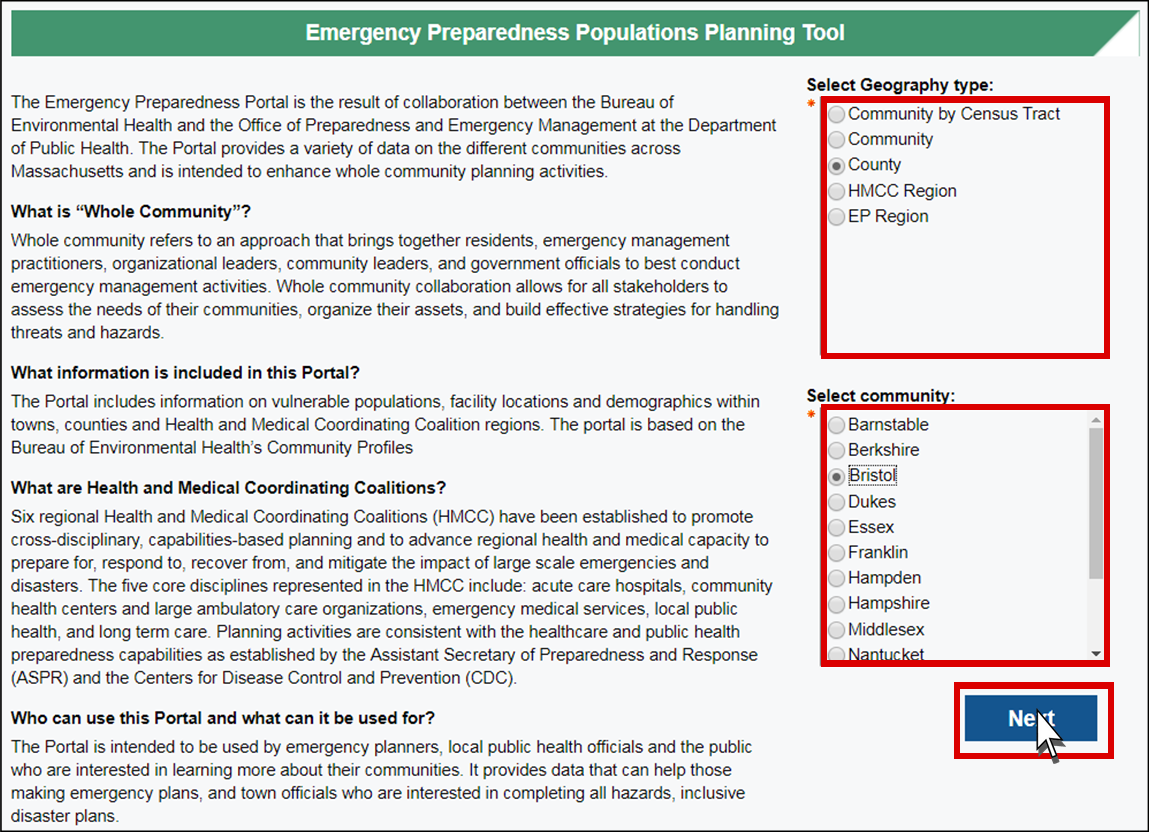
1. Portal:

Use this page for general information about the portal. Select a geography type and a community. Then, click “Next”.
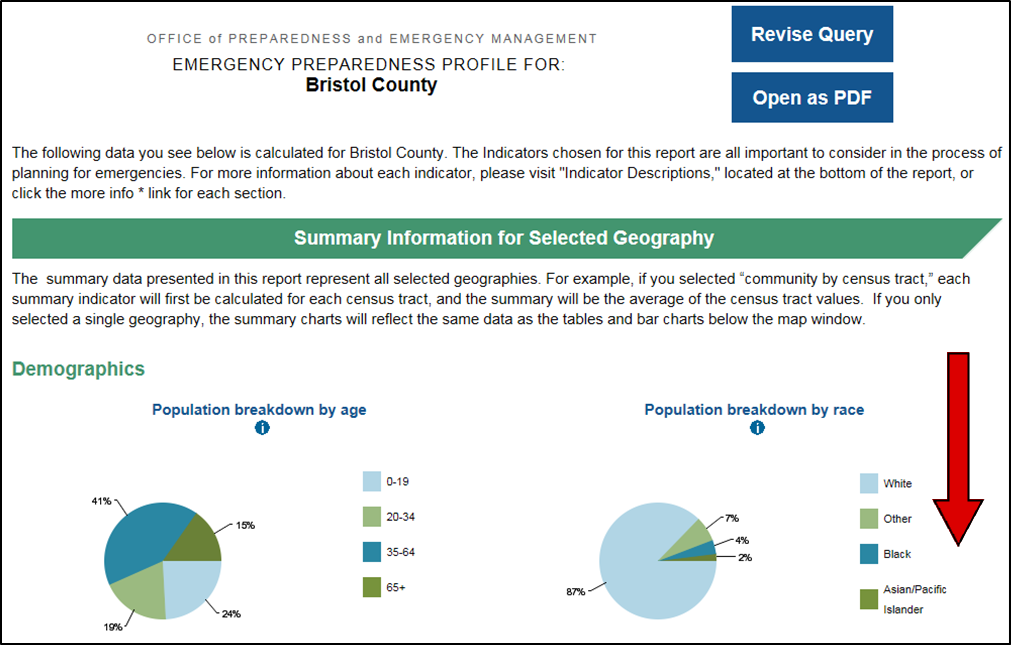
The emergency preparedness portal has paragraphs of information on the left side about the portal. On the right side there is a box titled Select Geography type outlined in red with multiple choice options: Community by Census Tract, Community, County, HMCC Region, and EP Region. The County bubble is selected. Below it, there is another box titled Select Community, also outlined in red, with multiple choice options for the county. The Bristol bubble is selected. Underneath, there is a blue Next box outlined in red with a cursor clicking on it.

2. Profile:

The emergency preparedness profile will appear with summary information at the top of the page. Scroll down for the map.
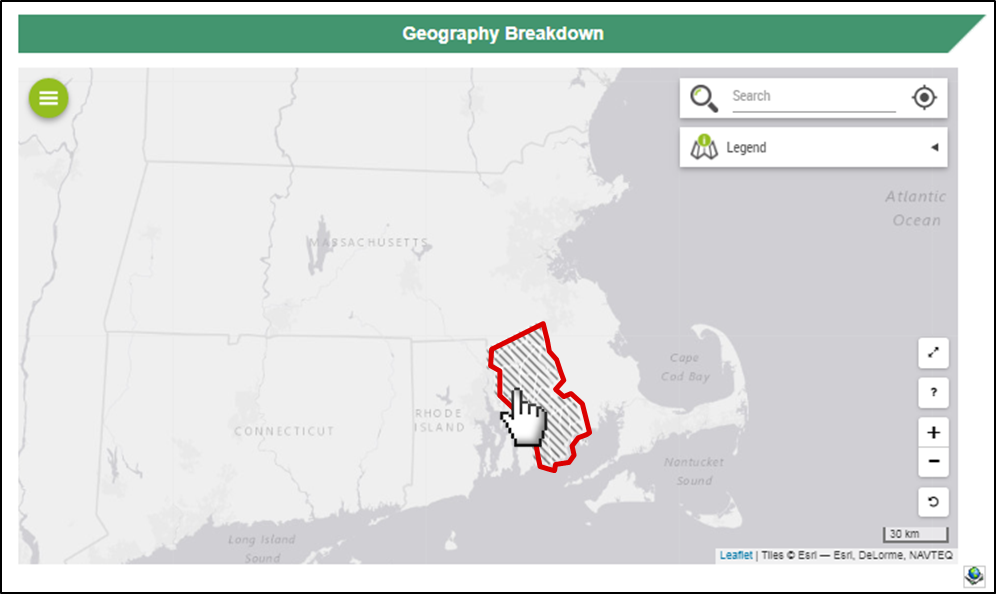
There is an Emergency Preparedness Profile for Bristol County with summary information. There is a red arrow pointing downward indicating scrolling the mouse wheel.

3. Map:

The map is located under “Geography Breakdown”. Your community is highlighted with gray thatching. Click on it for more information.

There is a map Massachusetts labeled Geography Breakdown. There is a pointed hand cursor clicking on Bristol County, outlined in red.

4. Statistics:

A box with statistics will appear on the right side of the page. Use the “x” at the top right to close.
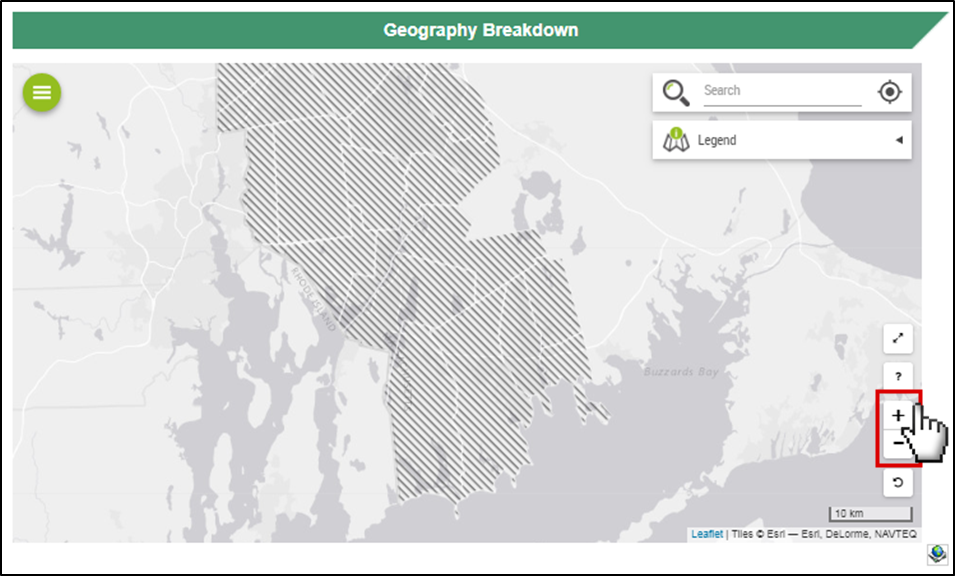
There is a Selected Geography box on the right side of the page outlined in red. Information includes Community (Taunton), County (293), EOHHS Region (Bristol), EP Region (Southeast Region), HMCC Region (Bristol County Public Health Coalition), CHNA Region (5), and RPA (Greater Attleboro-Taunton Health Education).

5. Zoom In or Out:

To zoom in, click the “+” or use your mouse wheel to scroll up. To zoom out, click the “-” or use your mouse wheel to scroll down.
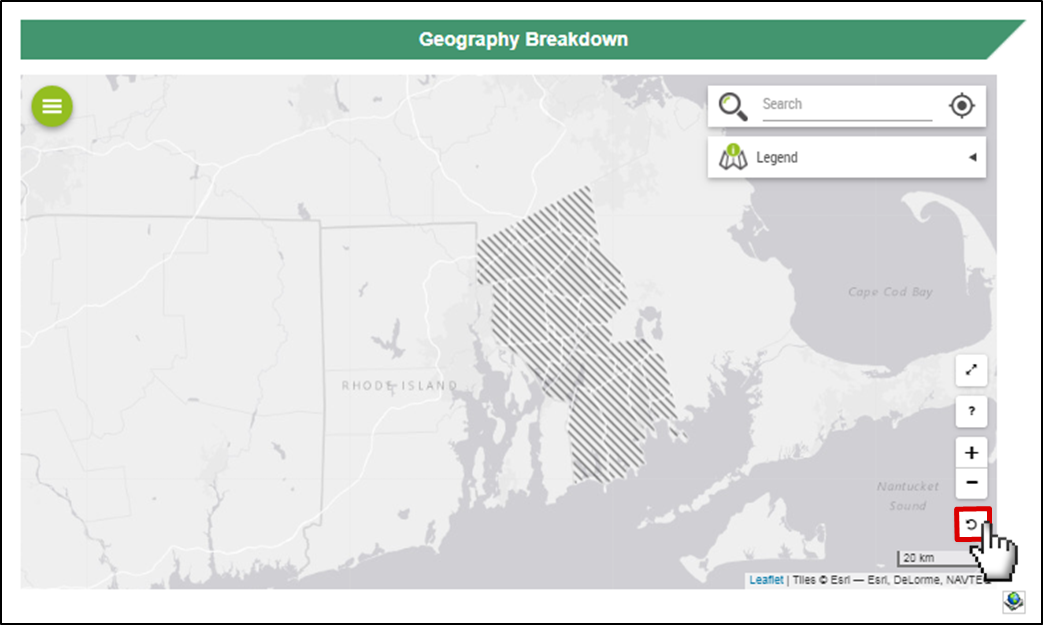
There is a red outline around the plus and minus buttons on the bottom right side of the page with a pointed hand cursor clicking on the plus button. The map is zoomed in.

6. Undo:

Click the undo button to remove previous zoom level.
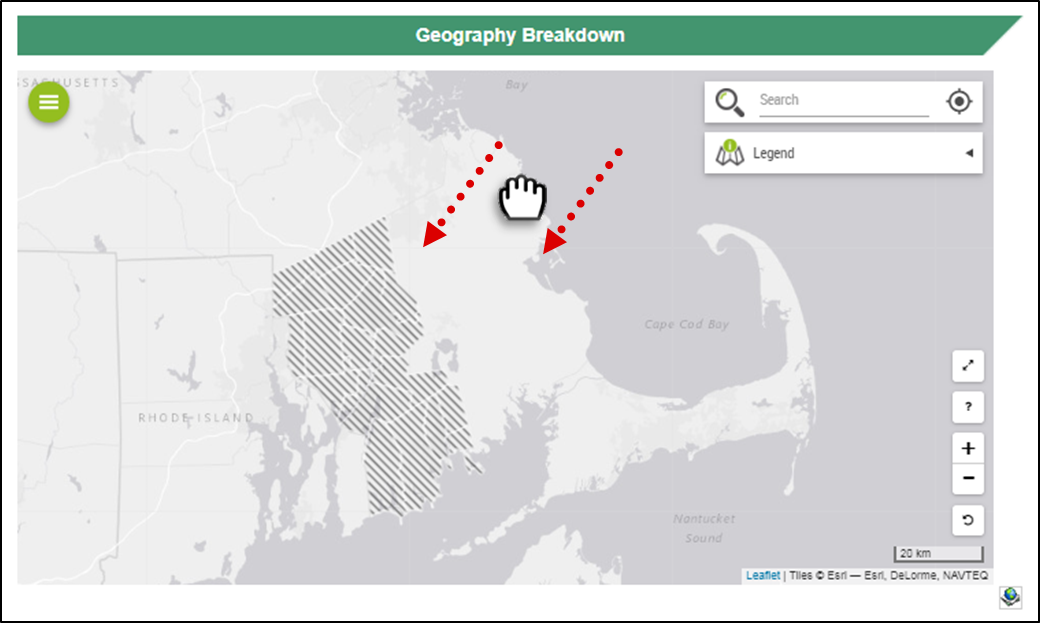
There is a red box around an undo button, which looks like an arrow pointing in a circular, counter clockwise direction. It is on the bottom right corner of the map window, and has a pointed hand cursor clicking on.

7. Moving the Map:

Click on the map window and hold, so that the cursor is a closed fist. Drag where you want to move the map. You can also use the arrows on your keyboard.
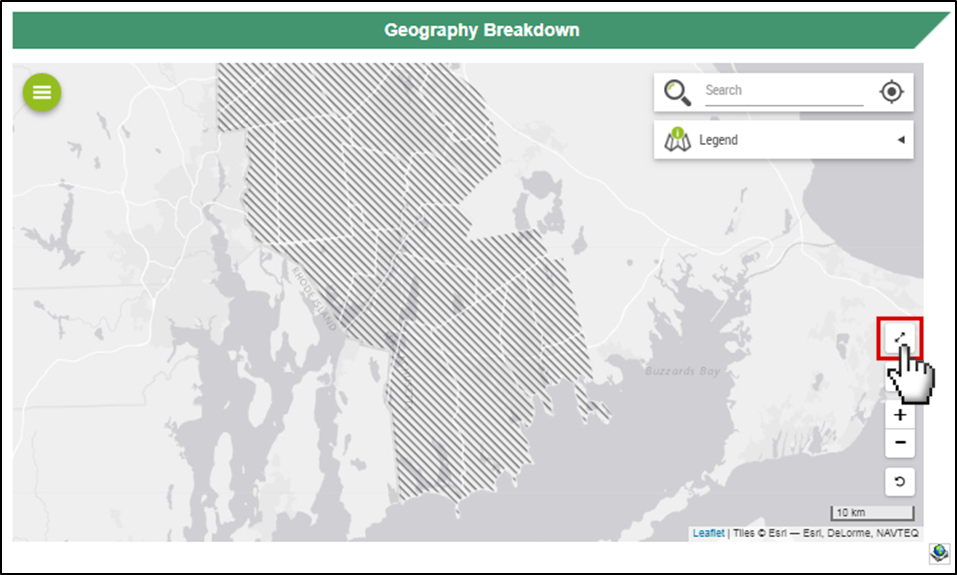
There is a fist cursor pulling the page downward with two red dashed arrows indicating movement.

8. Full Screen:

Click on the double arrows button to enlarge the map in a new browser window.

There is a red box around a button that looks like two arrows pointing away from each other at an angle. The arrows button is on the right side of the map window, and has a cursor clicking on it.

9. Print Map:

Click on the green circle icon on the top left of the map.
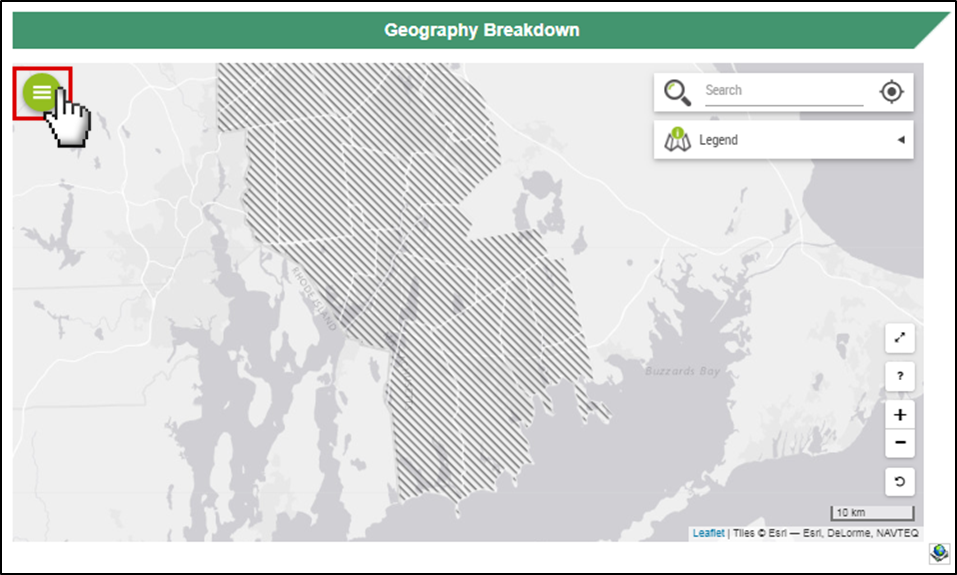
There is a red box around a green circle menu icon, which has three horizontal white lines in the center of it. The menu icon is on the upper left of the map window, and has a pointed hand cursor clicking on it.

10. Layers:

Click on the layers icon. If you hover your cursor over it, the word “LAYERS” will appear.
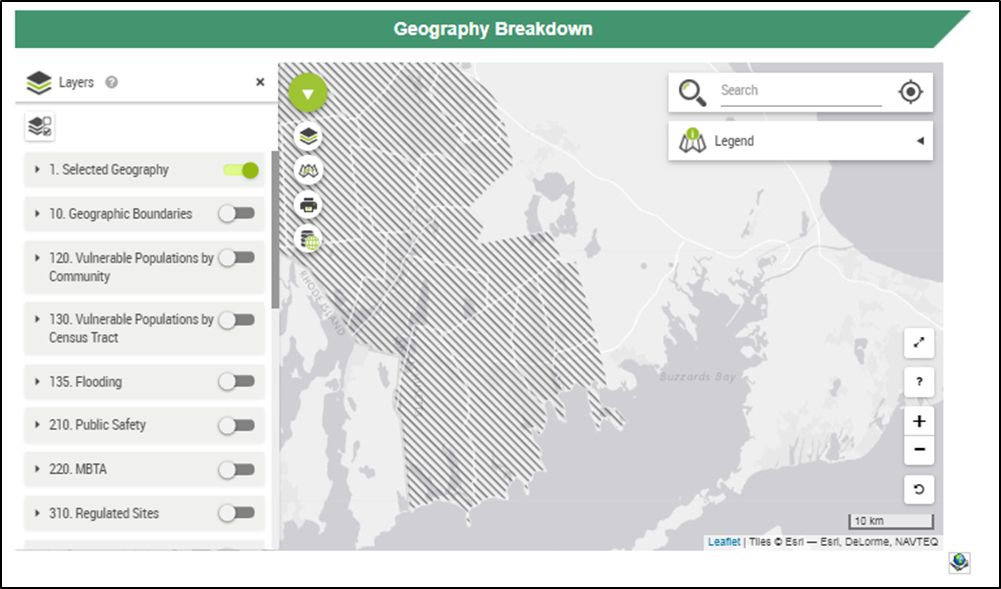
The screenshot has a red box around the layers icon, which looks like squares stacked over one another. The layers icon is the first option below the green circle menu icon, and has a pointed hand cursor clicking on it. The word LAYERS in all capital letters is next to the icon.

11. Layers:

This setting has many different features to add to the map, including: geographic boundaries, vulnerable populations, flooding, public safety, MBTA, regulated sites, air quality, and weather.
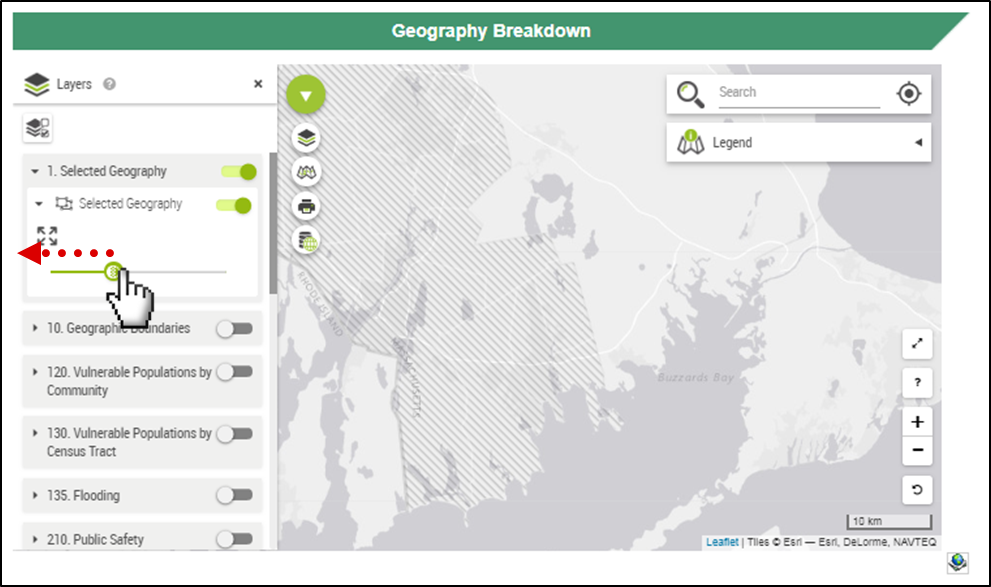
The layers tab is open with multiple options including Selected Geography, Geographic Boundaries, Vulnerable Populations by Community, Vulnerable Populations by Census Tract, Flooding, Public Safety, MBTA, and Regulated Sites.

12. Layers:

Click on “Selected Geography” tab. Click, hold, and drag the slide bar to the left to adjust for transparency.
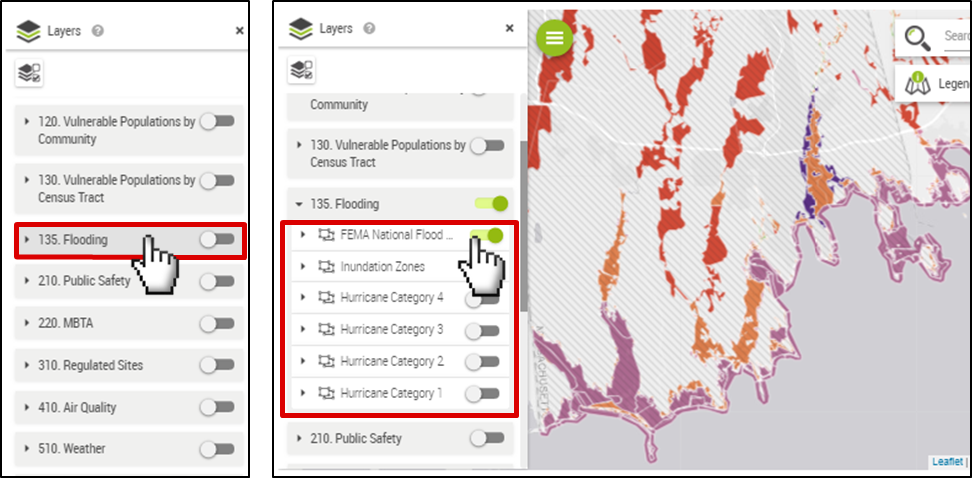
The selected geography tab is open, which includes a line with a green circle over it. The line is green on the left side of the circle and gray on the right side, indicating the level of transparency. There is a pointed hand cursor sliding the green circle to the left and a red dotted arrow pointing left to represent the sliding motion. The transparency of Bristol County is faded on the map.

13. Layers:

Click on a tab and select a feature by clicking on a gray toggle, so that it slides and turns green. You may need to zoom in on the map.
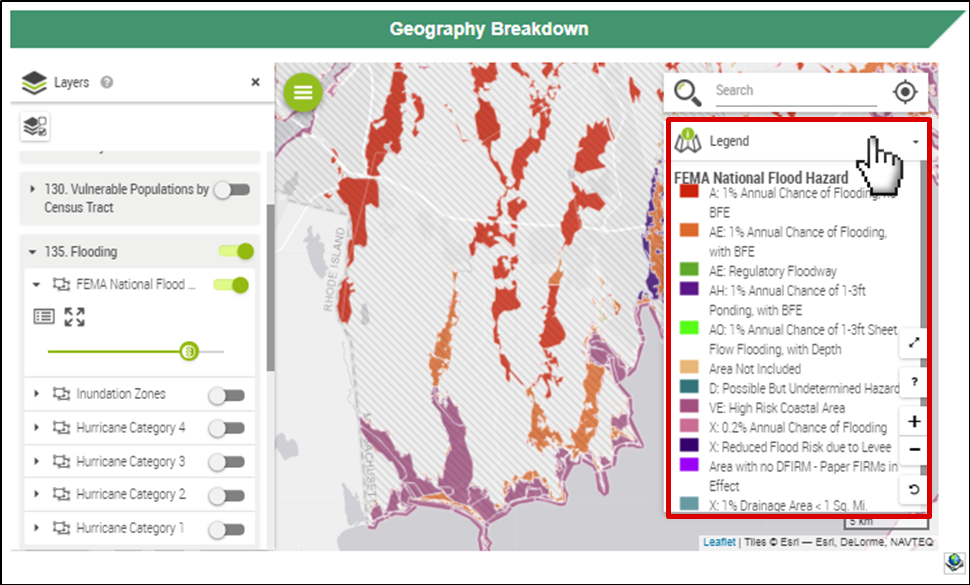
There are two screenshot panels. The first has a red outline around the Flooding tab with a pointed hand cursor clicking on it. The second has the Flooding tab open with options FEMA National Flood Hazard, Inundation Zone, Hurricane Category 4, Hurricane Category 3, Hurricane Category 2, and Hurricane Category 1. FEMA National Flood Hazard is selected with a pointed hand cursor, so that the gray toggle is green. The map has different colors on it representing degrees of flooding.

14. Legend:

Click on the “Legend” tab for the color coding or symbols used.
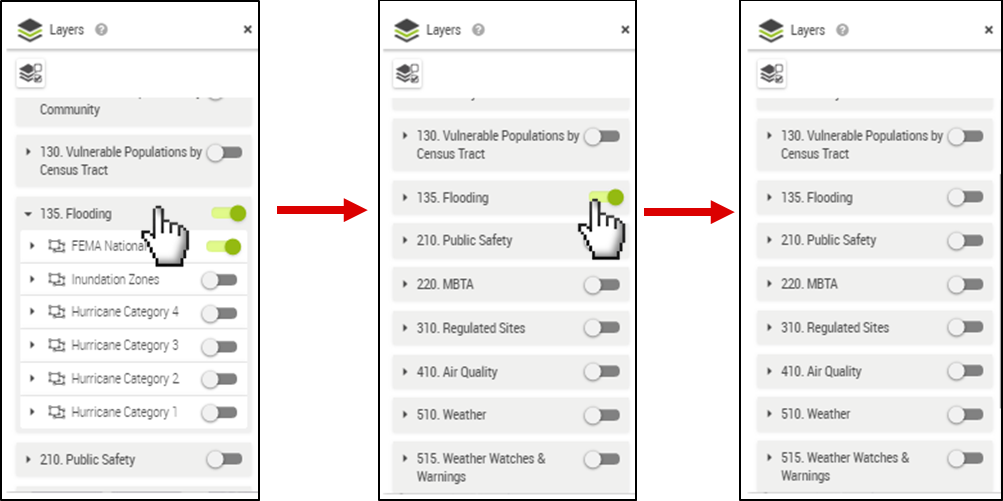
There is a pointed hand cursor clicking on the Legend tab. The tab is open with different colors representing: 1% Annual Chance of Flooding no BFE, 1% Annual Chance of Flooding with BFE, Regulatory Floodway, 1% Annual Chance of 1-3ft Ponding with BFE, 1% Annual Chance of 1-3ft Sheet Flow Flooding with Depth, Area Not Included, Possible But Undermined Hazard, High Risk Coastal Area, 0.2% Annual Chance of Flooding, Reduced Flood Risk due to Levee, Area with no DFIRM- Paper FIRMs in Effect, and 1% Drainage Area < 1 Sq. Mi.

15. Remove a Layer:

Click on the tab to close it and click on the green toggle, so that it slides and turns gray.

There are 3 screenshot panels. The first has a pointed hand cursor clicking on the open Flooding tab. In the second, the Flooding tab is closed and there is a pointed hand cursor clicking on the green toggle. The third panel shows that the toggle is gray and the setting is turned off.

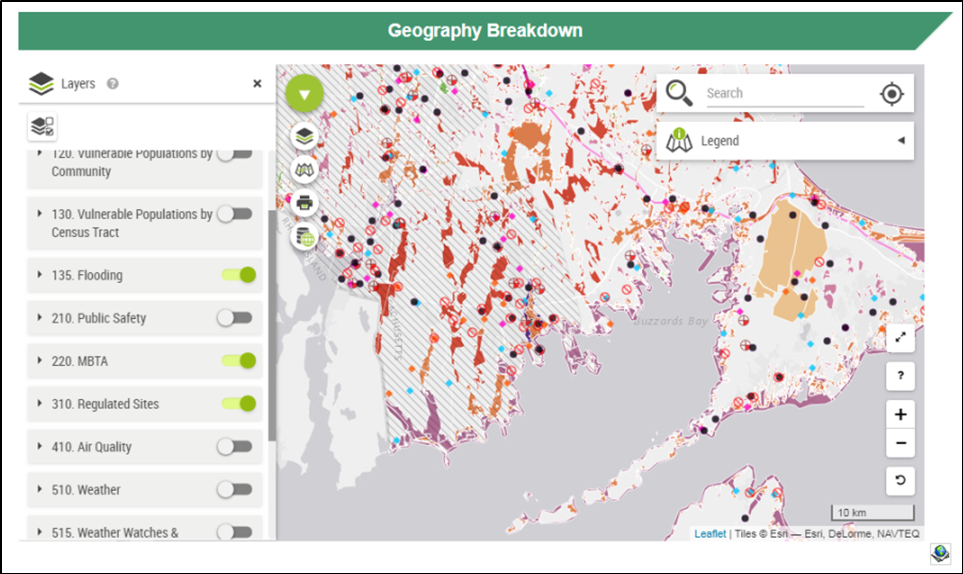
16. Multiple Layers:

You can click on more than one tab and/or feature to put multiple layers on the map. This map has flooding, MBTA, and regulated sites layers.
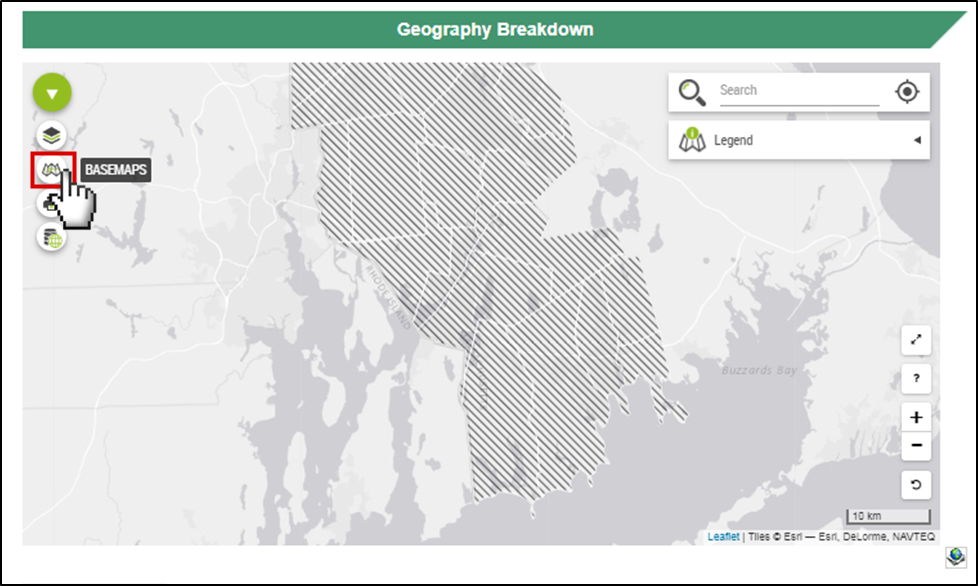
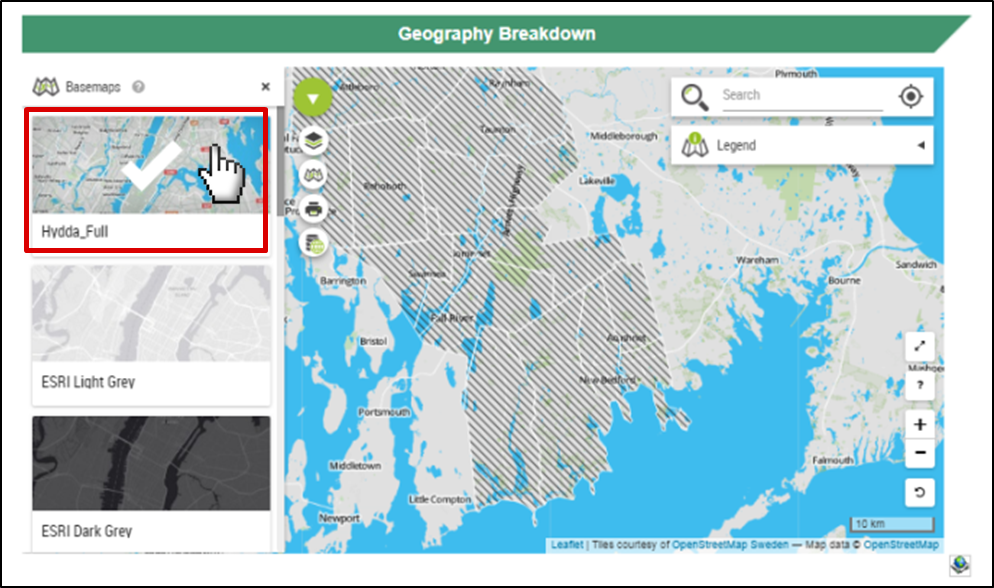
The map has green toggles on the Flooding, MBTA, and Regulated Sites tabs. The map has different colors on it representing degrees of flooding. There are blue, pink, and red dots representing regulated sites. There are purple lines representing MBTA transportation.

17. Base Maps:

Click on the base maps icon. When you hover your cursor over it, the word “BASEMAPS” will appear.

The screenshot has a red box around the base maps icon, which looks like a folded paper map. The base map is the second option under the green circle menu icon, and has a pointed hand cursor clicking on it. The word BASEMAPS in all capital letters is next to the icon.

18. Base Maps:

Select a map type. There are a variety of street map options.
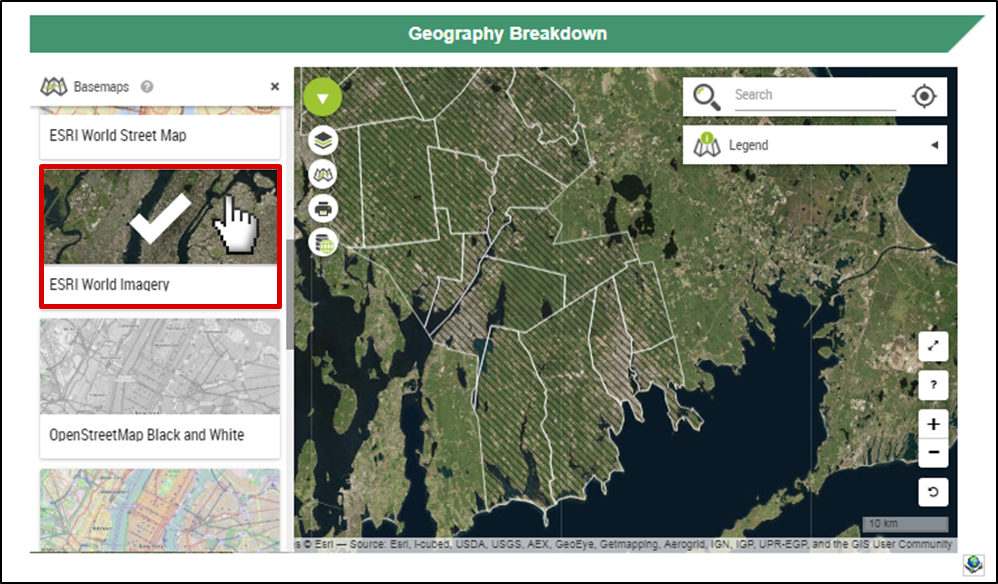
The screenshot has 3 map selection options panels on the left-hand side of the page with a red box around “Hydda_Full”. A pointed hand cursor is clicking on it and there is a large white check mark on the selected panel. The map displays labeled streets in the map view window.

19. Base Maps:

There is also a satellite map option under “ESRI World Imagery”.
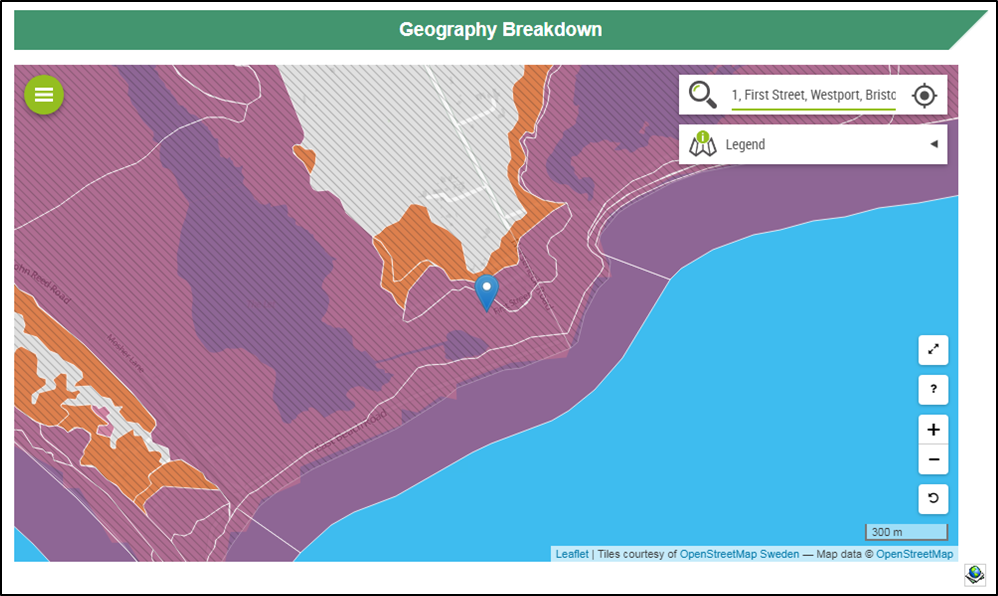
The screenshot has 3 panels on the left-hand side of the page with a red box around ESRI World Imagery. A pointed hand cursor is clicking on it and there is a large white check mark on the selected panel. The map displays a satellite image in the map view window.

20. Address Search:

Type an address in the search bar.Click on the desired location from the dropdown menu.
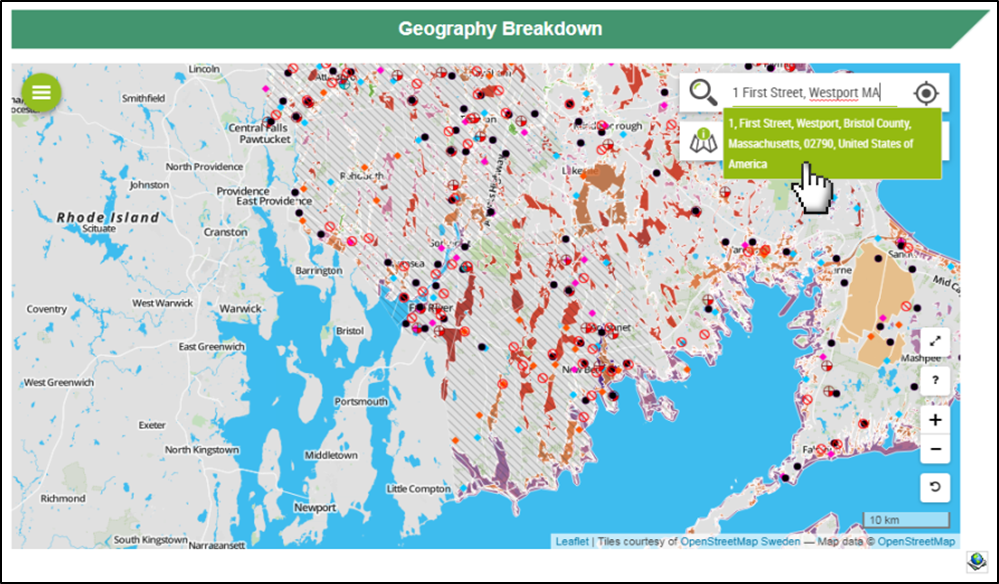
There is a red box around the search bar with the words “1 First Street, Westport MA” typed as an example. There is a green box underneath with the official address and a pointed hand cursor is clicking on it.

21. Address Search:

You will automatically be redirected to the location (blue pin).

The map is zoomed in on the location with a blue pin marking the selected address.
This page was last edited on: